Translate AMICOR contents if you like

Wednesday, July 31, 2019

Thalidomid

Gostaria de saber mais sobre a Hanseníase em nosso Estado, Leprosário, e também Talidomida.
Quando criança, na década de 30 passei parte de meus anos numa vila de colonização Alemã no interior (Agudo, então distrito de Cachoeira) onde havia casos da doença e, de vez enquando, alguém desaparecia, e diziam que havia sido levado para o Leprosário. Quando eu ia para a Escola, passava frente a uma casa que ficava um tanto retirada da estrada (passávamos de longe por que diziam ser de família de leprosos...) Até hoje não sei bem, se era doença ou se era um prostíbulo, do qual não deveríamos nos aproximar...
Com relação à Talidomida, foi da época da segunda gestação da Dra. Valderês, e era prescrição para controlar hiperemese gravídica...

50 years ago, a drug that crippled a generation found new life as a leprosy treatment


Excerpt from the July 19, 1969 issue of Science News

BY 
1:00PM, JULY 25, 2019
thalidomide
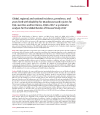
SECOND CHANCE  Thalidomide, a sedative prescribed to pregnant women in the 1950s and early 1960s, was banned for causing severe birth defects such as malformed limbs. The drug found new life, though, as a leprosy treatment, and is still used today.


Citations
Science News cover from July 19, 1969
Thalidomide helps severe cases —The drug that was banned because of its crippling effect on babies when taken as a tranquilizer and sleeping pill by pregnant women is being studied for its use in Hansen’s disease, or leprosy. Thalidomide has been tried on 22 leprosy patients … on an experimental basis with the permission of the U.S. Food and Drug Administration.… The primary action is to halt or prevent acute reactions such as fever and skin lesions. —  Science News, July 19, 1969

Update

The FDA approved thalidomide for leprous skin lesions in limited cases in 1975. Related drugs were approved after 2005 also to help control the immune system and calm inflammation. These drugs also treat psoriasis, arthritis and the blood cancer multiple myeloma. Birth defects remain a risk, so use of thalidomide and its analogs is controlled in the United States. But lax oversight elsewhere means thalidomide is still misused. In Brazil, nearly 200 children born from 2005 to 2010 may have been disabled by the drug, a 2015 study found. The World Health Organization discourages thalidomide use for leprosy. 
SN Staff. Leprosy: Thalidomide helps severe casesScience News. Vol. 96, July 19, 1969, p. 50.
F. Sales Luiz Vianna et al. Pharmacoepidemiology and thalidomide embryopathy surveillance in BrazilReproductive Toxicology. Published June 2015. doi: 10.1016/j.reprotox.2015.03.007.
Further Reading
N. Seppa. Thalidomide treats Crohn’s diseaseScience News. Vol. 185, January 11, 2014, p. 9.
SN Staff. Science Past from the issue of July, 1962Science News. Vol. 182, July 14, 2012, p. 4.
N. Seppa. Old and new drugs may fight multiple myelomaScience News. Vol. 158, December 16, 2000, p. 399.

Aging attitudes


FEATURE

Positive attitudes about aging may pay off in better health

newsletter imageJul 29 2019 6:00 AM
Research into the mind-body connection shows that attitude is everything when it comes to healthy aging.
READ MORE  

J.K. Rowling

Rowling, J.K.

LibraryThing

loranne@librarything.com

09:20 (há 21 minutos)
 para eu
LibraryThing: State of the Thing
Dear Aloyzio,
Welcome to the July 2019 State of the Thing. This month we're recounting the June meetup, tell us what you think about LibraryThing's design, and more.
If you'd rather receive a plain-text version, edit your email preferences. You can also read it online. Our newsletter archive lives here.
You can like LibraryThing on Facebook and follow @LibraryThing on Twitter for up-to-the-minute site news and updates.

LibraryThing/Litsy Meetup

Last month, a bunch of LibraryThing and Litsy members (including founder Tim Spalding) got together offline for a meetup at the American Library Association’s annual conference in Washington, D.C. It was great to match LibraryThing names with faces!

Tuesday, July 30, 2019

ASPIRIN for Primary Prevention

Recomendação do AMICOR

Luiz Carlos Bodanese

Anexos15:04 (há 0 minuto)
para eu
Envio esse interessante artigo para nosso Blog, com meus respeitos e consideração.
Grande abraço,
Bodanese
ASPIRIN for Primary Prevention-CV Events-JACC-jun2019.pdf
2413K Exibir como HTML Fazer o download
...


Área de anexos

Library

“My house is a library
with living rooms attached.”

– Bernard Berenson

World Bank Health


  • NEW BLOG by | Reminiscing a life at the World Bank. Thank you Patricio for your passion and dedication

    Global Burden of Disease 2017

    Global Burden of Disease 2017

    Goal: The Global Burden of Disease Study (GBD) is a comprehensive regional and global research program of disease burden that assesses mortality and disability from major diseases, injuries, and risk factors. GBD is a collaboration of over 1,800 researchers from 127 countries.

    Project log

    Ask a question to find out more about this project.
    Rajat Das Gupta
    added a research item
    BACKGROUND: Assessments of age-specific mortality and life expectancy have been done by the UN Population Division, Department of Economics and Social Affairs (UNPOP), the United States Census Bureau, WHO, and as part of previous iterations of the Global Burden of Diseases, Injuries, and Risk Factors Study (GBD). Previous iterations of the GBD used population estimates from UNPOP, which were not derived in a way that was internally consistent with the estimates of the numbers of deaths in the GBD. The present iteration of the GBD, GBD 2017, improves on previous assessments and provides timely estimates of the mortality experience of populations globally. METHODS: The GBD uses all available data to produce estimates of mortality rates between 1950 and 2017 for 23 age groups, both sexes, and 918 locations, including 195 countries and territories and subnational locations for 16 countries. Data used include vital registration systems, sample registration systems, household surveys (complete birth histories, summary birth histories, sibling histories), censuses (summary birth histories, household deaths), and Demographic Surveillance Sites. In total, this analysis used 8259 data sources. Estimates of the probability of death between birth and the age of 5 years and between ages 15 and 60 years are generated and then input into a model life table system to produce complete life tables for all locations and years. Fatal discontinuities and mortality due to HIV/AIDS are analysed separately and then incorporated into the estimation. We analyse the relationship between age-specific mortality and development status using the Socio-demographic Index, a composite measure based on fertility under the age of 25 years, education, and income. There are four main methodological improvements in GBD 2017 compared with GBD 2016: 622 additional data sources have been incorporated; new estimates of population, generated by the GBD study, are used; statistical methods used in different components of the analysis have been further standardised and improved; and the analysis has been extended backwards in time by two decades to start in 1950. FINDINGS: Globally, 18·7% (95% uncertainty interval 18·4-19·0) of deaths were registered in 1950 and that proportion has been steadily increasing since, with 58·8% (58·2-59·3) of all deaths being registered in 2015. At the global level, between 1950 and 2017, life expectancy increased from 48·1 years (46·5-49·6) to 70·5 years (70·1-70·8) for men and from 52·9 years (51·7-54·0) to 75·6 years (75·3-75·9) for women. Despite this overall progress, there remains substantial variation in life expectancy at birth in 2017, which ranges from 49·1 years (46·5-51·7) for men in the Central African Republic to 87·6 years (86·9-88·1) among women in Singapore. The greatest progress across age groups was for children younger than 5 years; under-5 mortality dropped from 216·0 deaths (196·3-238·1) per 1000 livebirths in 1950 to 38·9 deaths (35·6-42·83) per 1000 livebirths in 2017, with huge reductions across countries. Nevertheless, there were still 5·4 million (5·2-5·6) deaths among children younger than 5 years in the world in 2017. Progress has been less pronounced and more variable for adults, especially for adult males, who had stagnant or increasing mortality rates in several countries. The gap between male and female life expectancy between 1950 and 2017, while relatively stable at the global level, shows distinctive patterns across super-regions and has consistently been the largest in central Europe, eastern Europe, and central Asia, and smallest in south Asia. Performance was also variable across countries and time in observed mortality rates compared with those expected on the basis of development. INTERPRETATION: This analysis of age-sex-specific mortality shows that there are remarkably complex patterns in population mortality across countries. The findings of this study highlight global successes, such as the large decline in under-5 mortality, which reflects significant local, national, and global commitment and investment over several decades. However, they also bring attention to mortality patterns that are a cause for concern, particularly among adult men and, to a lesser extent, women, whose mortality rates have stagnated in many countries over the time period of this study, and in some cases are increasing. FUNDING: Bill & Melinda Gates Foundation.
    Mehedi Hasan
    added a research item
    Background Efforts to establish the 2015 baseline and monitor early implementation of the UN Sustainable Development Goals (SDGs) highlight both great potential for and threats to improving health by 2030. To fully deliver on the SDG aim of “leaving no one behind”, it is increasingly important to examine the health-related SDGs beyond national-level estimates. As part of the Global Burden of Diseases, Injuries, and Risk Factors Study 2017 (GBD 2017), we measured progress on 41 of 52 health-related SDG indicators and estimated the health-related SDG index for 195 countries and territories for the period 1990–2017, projected indicators to 2030, and analysed global attainment. Methods We measured progress on 41 health-related SDG indicators from 1990 to 2017, an increase of four indicators since GBD 2016 (new indicators were health worker density, sexual violence by non-intimate partners, population census status, and prevalence of physical and sexual violence [reported separately]). We also improved the measurement of several previously reported indicators. We constructed national-level estimates and, for a subset of health-related SDGs, examined indicator-level differences by sex and Socio-demographic Index (SDI) quintile. We also did subnational assessments of performance for selected countries. To construct the health-related SDG index, we transformed the value for each indicator on a scale of 0–100, with 0 as the 2·5th percentile and 100 as the 97·5th percentile of 1000 draws calculated from 1990 to 2030, and took the geometric mean of the scaled indicators by target. To generate projections through 2030, we used a forecasting framework that drew estimates from the broader GBD study and used weighted averages of indicator-specific and country-specific annualised rates of change from 1990 to 2017 to inform future estimates. We assessed attainment of indicators with defined targets in two ways: first, using mean values projected for 2030, and then using the probability of attainment in 2030 calculated from 1000 draws. We also did a global attainment analysis of the feasibility of attaining SDG targets on the basis of past trends. Using 2015 global averages of indicators with defined SDG targets, we calculated the global annualised rates of change required from 2015 to 2030 to meet these targets, and then identified in what percentiles the required global annualised rates of change fell in the distribution of country-level rates of change from 1990 to 2015. We took the mean of these global percentile values across indicators and applied the past rate of change at this mean global percentile to all health-related SDG indicators, irrespective of target definition, to estimate the equivalent 2030 global average value and percentage change from 2015 to 2030 for each indicator. Findings The global median health-related SDG index in 2017 was 59·4 (IQR 35·4–67·3), ranging from a low of 11·6 (95% uncertainty interval 9·6–14·0) to a high of 84·9 (83·1–86·7). SDG index values in countries assessed at the subnational level varied substantially, particularly in China and India, although scores in Japan and the UK were more homogeneous. Indicators also varied by SDI quintile and sex, with males having worse outcomes than females for non-communicable disease (NCD) mortality, alcohol use, and smoking, among others. Most countries were projected to have a higher health-related SDG index in 2030 than in 2017, while country-level probabilities of attainment by 2030 varied widely by indicator. Under-5 mortality, neonatal mortality, maternal mortality ratio, and malaria indicators had the most countries with at least 95% probability of target attainment. Other indicators, including NCD mortality and suicide mortality, had no countries projected to meet corresponding SDG targets on the basis of projected mean values for 2030 but showed some probability of attainment by 2030. For some indicators, including child malnutrition, several infectious diseases, and most violence measures, the annualised rates of change required to meet SDG targets far exceeded the pace of progress achieved by any country in the recent past. We found that applying the mean global annualised rate of change to indicators without defined targets would equate to about 19% and 22% reductions in global smoking and alcohol consumption, respectively; a 47% decline in adolescent birth rates; and a more than 85% increase in health worker density per 1000 population by 2030. Interpretation The GBD study offers a unique, robust platform for monitoring the health-related SDGs across demographic and geographic dimensions. Our findings underscore the importance of increased collection and analysis of disaggregated data and highlight where more deliberate design or targeting of interventions could accelerate progress in attaining the SDGs. Current projections show that many health-related SDG indicators, NCDs, NCD-related risks, and violence-related indicators will require a concerted shift away from what might have driven past gains—curative interventions in the case of NCDs—towards multisectoral, prevention-oriented policy action and investments to achieve SDG aims. Notably, several targets, if they are to be met by 2030, demand a pace of progress that no country has achieved in the recent past. The future is fundamentally uncertain, and no model can fully predict what breakthroughs or events might alter the course of the SDGs. What is clear is that our actions—or inaction—today will ultimately dictate how close the world, collectively, can get to leaving no one behind by 2030.
    Mehedi Hasan
    added a research item
    Background: Assessments of age-specific mortality and life expectancy have been done by the UN Population Division, Department of Economics and Social Affairs (UNPOP), the United States Census Bureau, WHO, and as part of previous iterations of the Global Burden of Diseases, Injuries, and Risk Factors Study (GBD). Previous iterations of the GBD used population estimates from UNPOP, which were not derived in a way that was internally consistent with the estimates of the numbers of deaths in the GBD. The present iteration of the GBD, GBD 2017, improves on previous assessments and provides timely estimates of the mortality experience of populations globally. Methods: The GBD uses all available data to produce estimates of mortality rates between 1950 and 2017 for 23 age groups, both sexes, and 918 locations, including 195 countries and territories and subnational locations for 16 countries. Data used include vital registration systems, sample registration systems, household surveys (complete birth histories, summary birth histories, sibling histories), censuses (summary birth histories, household deaths), and Demographic Surveillance Sites. In total, this analysis used 8259 data sources. Estimates of the probability of death between birth and the age of 5 years and between ages 15 and 60 years are generated and then input into a model life table system to produce complete life tables for all locations and years. Fatal discontinuities and mortality due to HIV/AIDS are analysed separately and then incorporated into the estimation. We analyse the relationship between age-specific mortality and development status using the Socio-demographic Index, a composite measure based on fertility under the age of 25 years, education, and income. There are four main methodological improvements in GBD 2017 compared with GBD 2016: 622 additional data sources have been incorporated; new estimates of population, generated by the GBD study, are used; statistical methods used in different components of the analysis have been further standardised and improved; and the analysis has been extended backwards in time by two decades to start in 1950. Findings: Globally, 18·7% (95% uncertainty interval 18·4–19·0) of deaths were registered in 1950 and that proportion has been steadily increasing since, with 58·8% (58·2–59·3) of all deaths being registered in 2015. At the global level, between 1950 and 2017, life expectancy increased from 48·1 years (46·5–49·6) to 70·5 years (70·1–70·8) for men and from 52·9 years (51·7–54·0) to 75·6 years (75·3–75·9) for women. Despite this overall progress, there remains substantial variation in life expectancy at birth in 2017, which ranges from 49·1 years (46·5–51·7) for men in the Central African Republic to 87·6 years (86·9–88·1) among women in Singapore. The greatest progress across age groups was for children younger than 5 years; under-5 mortality dropped from 216·0 deaths (196·3–238·1) per 1000 livebirths in 1950 to 38·9 deaths (35·6–42·83) per 1000 livebirths in 2017, with huge reductions across countries. Nevertheless, there were still 5·4 million (5·2–5·6) deaths among children younger than 5 years in the world in 2017. Progress has been less pronounced and more variable for adults, especially for adult males, who had stagnant or increasing mortality rates in several countries. The gap between male and female life expectancy between 1950 and 2017, while relatively stable at the global level, shows distinctive patterns across super-regions and has consistently been the largest in central Europe, eastern Europe, and central Asia, and smallest in south Asia. Performance was also variable across countries and time in observed mortality rates compared with those expected on the basis of development. Interpretation: This analysis of age-sex-specific mortality shows that there are remarkably complex patterns in population mortality across countries. The findings of this study highlight global successes, such as the large decline in under-5 mortality, which reflects significant local, national, and global commitment and investment over several decades. However, they also bring attention to mortality patterns that are a cause for concern, particularly among adult men and, to a lesser extent, women, whose mortality rates have stagnated in many countries over the time period of this study, and in some cases are increasing. Funding: Bill & Melinda Gates Foundation.
    Varshil Mehta
    added an update
    Join the Medkrux research group.
    … 
    Mehedi Hasan
    added 3 research items
    Background The Global Burden of Diseases, Injuries, and Risk Factors Study 2017 (GBD 2017) includes a comprehensive assessment of incidence, prevalence, and years lived with disability (YLDs) for 354 causes in 195 countries and territories from 1990 to 2017. Previous GBD studies have shown how the decline of mortality rates from 1990 to 2016 has led to an increase in life expectancy, an ageing global population, and an expansion of the non-fatal burden of disease and injury. These studies have also shown how a substantial portion of the world's population experiences non-fatal health loss with considerable heterogeneity among different causes, locations, ages, and sexes. Ongoing objectives of the GBD study include increasing the level of estimation detail, improving analytical strategies, and increasing the amount of high-quality data. Methods We estimated incidence and prevalence for 354 diseases and injuries and 3484 sequelae. We used an updated and extensive body of literature studies, survey data, surveillance data, inpatient admission records, outpatient visit records, and health insurance claims, and additionally used results from cause of death models to inform estimates using a total of 68 781 data sources. Newly available clinical data from India, Iran, Japan, Jordan, Nepal, China, Brazil, Norway, and Italy were incorporated, as well as updated claims data from the USA and new claims data from Taiwan (province of China) and Singapore. We used DisMod-MR 2.1, a Bayesian meta-regression tool, as the main method of estimation, ensuring consistency between rates of incidence, prevalence, remission, and cause of death for each condition. YLDs were estimated as the product of a prevalence estimate and a disability weight for health states of each mutually exclusive sequela, adjusted for comorbidity. We updated the Socio-demographic Index (SDI), a summary development indicator of income per capita, years of schooling, and total fertility rate. Additionally, we calculated differences between male and female YLDs to identify divergent trends across sexes. GBD 2017 complies with the Guidelines for Accurate and Transparent Health Estimates Reporting. Findings Globally, for females, the causes with the greatest age-standardised prevalence were oral disorders, headache disorders, and haemoglobinopathies and haemolytic anaemias in both 1990 and 2017. For males, the causes with the greatest age-standardised prevalence were oral disorders, headache disorders, and tuberculosis including latent tuberculosis infection in both 1990 and 2017. In terms of YLDs, low back pain, headache disorders, and dietary iron deficiency were the leading Level 3 causes of YLD counts in 1990, whereas low back pain, headache disorders, and depressive disorders were the leading causes in 2017 for both sexes combined. All-cause age-standardised YLD rates decreased by 3·9% (95% uncertainty interval [UI] 3·1–4·6) from 1990 to 2017; however, the all-age YLD rate increased by 7·2% (6·0–8·4) while the total sum of global YLDs increased from 562 million (421–723) to 853 million (642–1100). The increases for males and females were similar, with increases in all-age YLD rates of 7·9% (6·6–9·2) for males and 6·5% (5·4–7·7) for females. We found significant differences between males and females in terms of age-standardised prevalence estimates for multiple causes. The causes with the greatest relative differences between sexes in 2017 included substance use disorders (3018 cases [95% UI 2782–3252] per 100 000 in males vs s1400 [1279–1524] per 100 000 in females), transport injuries (3322 [3082–3583] vs 2336 [2154–2535]), and self-harm and interpersonal violence (3265 [2943–3630] vs 5643 [5057–6302]). Interpretation Global all-cause age-standardised YLD rates have improved only slightly over a period spanning nearly three decades. However, the magnitude of the non-fatal disease burden has expanded globally, with increasing numbers of people who have a wide spectrum of conditions. A subset of conditions has remained globally pervasive since 1990, whereas other conditions have displayed more dynamic trends, with different ages, sexes, and geographies across the globe experiencing varying burdens and trends of health loss. This study emphasises how global improvements in premature mortality for select conditions have led to older populations with complex and potentially expensive diseases, yet also highlights global achievements in certain domains of disease and injury.
    Background The Global Burden of Diseases, Injuries, and Risk Factors Study 2017 (GBD 2017) includes a comprehensive assessment of incidence, prevalence, and years lived with disability (YLDs) for 354 causes in 195 countries and territories from 1990 to 2017. Previous GBD studies have shown how the decline of mortality rates from 1990 to 2016 has led to an increase in life expectancy, an ageing global population, and an expansion of the non-fatal burden of disease and injury. These studies have also shown how a substantial portion of the world's population experiences non-fatal health loss with considerable heterogeneity among different causes, locations, ages, and sexes. Ongoing objectives of the GBD study include increasing the level of estimation detail, improving analytical strategies, and increasing the amount of high-quality data. Methods We estimated incidence and prevalence for 354 diseases and injuries and 3484 sequelae. We used an updated and extensive body of literature studies, survey data, surveillance data, inpatient admission records, outpatient visit records, and health insurance claims, and additionally used results from cause of death models to inform estimates using a total of 68 781 data sources. Newly available clinical data from India, Iran, Japan, Jordan, Nepal, China, Brazil, Norway, and Italy were incorporated, as well as updated claims data from the USA and new claims data from Taiwan (province of China) and Singapore. We used DisMod-MR 2.1, a Bayesian meta-regression tool, as the main method of estimation, ensuring consistency between rates of incidence, prevalence, remission, and cause of death for each condition. YLDs were estimated as the product of a prevalence estimate and a disability weight for health states of each mutually exclusive sequela, adjusted for comorbidity. We updated the Socio-demographic Index (SDI), a summary development indicator of income per capita, years of schooling, and total fertility rate. Additionally, we calculated differences between male and female YLDs to identify divergent trends across sexes. GBD 2017 complies with the Guidelines for Accurate and Transparent Health Estimates Reporting. Findings Globally, for females, the causes with the greatest age-standardised prevalence were oral disorders, headache disorders, and haemoglobinopathies and haemolytic anaemias in both 1990 and 2017. For males, the causes with the greatest age-standardised prevalence were oral disorders, headache disorders, and tuberculosis including latent tuberculosis infection in both 1990 and 2017. In terms of YLDs, low back pain, headache disorders, and dietary iron deficiency were the leading Level 3 causes of YLD counts in 1990, whereas low back pain, headache disorders, and depressive disorders were the leading causes in 2017 for both sexes combined. All-cause age-standardised YLD rates decreased by 3·9% (95% uncertainty interval [UI] 3·1–4·6) from 1990 to 2017; however, the all-age YLD rate increased by 7·2% (6·0–8·4) while the total sum of global YLDs increased from 562 million (421–723) to 853 million (642–1100). The increases for males and females were similar, with increases in all-age YLD rates of 7·9% (6·6–9·2) for males and 6·5% (5·4–7·7) for females. We found significant differences between males and females in terms of age-standardised prevalence estimates for multiple causes. The causes with the greatest relative differences between sexes in 2017 included substance use disorders (3018 cases [95% UI 2782–3252] per 100 000 in males vs s1400 [1279–1524] per 100 000 in females), transport injuries (3322 [3082–3583] vs 2336 [2154–2535]), and self-harm and interpersonal violence (3265 [2943–3630] vs 5643 [5057–6302]). Interpretation Global all-cause age-standardised YLD rates have improved only slightly over a period spanning nearly three decades. However, the magnitude of the non-fatal disease burden has expanded globally, with increasing numbers of people who have a wide spectrum of conditions. A subset of conditions has remained globally pervasive since 1990, whereas other conditions have displayed more dynamic trends, with different ages, sexes, and geographies across the globe experiencing varying burdens and trends of health loss. This study emphasises how global improvements in premature mortality for select conditions have led to older populations with complex and potentially expensive diseases, yet also highlights global achievements in certain domains of disease and injury. Funding Bill & Melinda Gates Foundation.
    Background Population estimates underpin demographic and epidemiological research and are used to track progress on numerous international indicators of health and development. To date, internationally available estimates of population and fertility, although useful, have not been produced with transparent and replicable methods and do not use standardised estimates of mortality. We present single-calendar year and single-year of age estimates of fertility and population by sex with standardised and replicable methods. Methods We estimated population in 195 locations by single year of age and single calendar year from 1950 to 2017 with standardised and replicable methods. We based the estimates on the demographic balancing equation, with inputs of fertility, mortality, population, and migration data. Fertility data came from 7817 location-years of vital registration data, 429 surveys reporting complete birth histories, and 977 surveys and censuses reporting summary birth histories. We estimated age-specific fertility rates (ASFRs; the annual number of livebirths to women of a specified age group per 1000 women in that age group) by use of spatiotemporal Gaussian process regression and used the ASFRs to estimate total fertility rates (TFRs; the average number of children a woman would bear if she survived through the end of the reproductive age span [age 10–54 years] and experienced at each age a particular set of ASFRs observed in the year of interest). Because of sparse data, fertility at ages 10–14 years and 50–54 years was estimated from data on fertility in women aged 15–19 years and 45–49 years, through use of linear regression. Age-specific mortality data came from the Global Burden of Diseases, Injuries, and Risk Factors Study (GBD) 2017 estimates. Data on population came from 1257 censuses and 761 population registry location-years and were adjusted for underenumeration and age misreporting with standard demographic methods. Migration was estimated with the GBD Bayesian demographic balancing model, after incorporating information about refugee migration into the model prior. Final population estimates used the cohort-component method of population projection, with inputs of fertility, mortality, and migration data. Population uncertainty was estimated by use of out-of-sample predictive validity testing. With these data, we estimated the trends in population by age and sex and in fertility by age between 1950 and 2017 in 195 countries and territories. Findings From 1950 to 2017, TFRs decreased by 49·4% (95% uncertainty interval [UI] 46·4–52·0). The TFR decreased from 4·7 livebirths (4·5–4·9) to 2·4 livebirths (2·2–2·5), and the ASFR of mothers aged 10–19 years decreased from 37 livebirths (34–40) to 22 livebirths (19–24) per 1000 women. Despite reductions in the TFR, the global population has been increasing by an average of 83·8 million people per year since 1985. The global population increased by 197·2% (193·3–200·8) since 1950, from 2·6 billion (2·5–2·6) to 7·6 billion (7·4–7·9) people in 2017; much of this increase was in the proportion of the global population in south Asia and sub-Saharan Africa. The global annual rate of population growth increased between 1950 and 1964, when it peaked at 2·0%; this rate then remained nearly constant until 1970 and then decreased to 1·1% in 2017. Population growth rates in the southeast Asia, east Asia, and Oceania GBD super-region decreased from 2·5% in 1963 to 0·7% in 2017, whereas in sub-Saharan Africa, population growth rates were almost at the highest reported levels ever in 2017, when they were at 2·7%. The global average age increased from 26·6 years in 1950 to 32·1 years in 2017, and the proportion of the population that is of working age (age 15–64 years) increased from 59·9% to 65·3%. At the national level, the TFR decreased in all countries and territories between 1950 and 2017; in 2017, TFRs ranged from a low of 1·0 livebirths (95% UI 0·9–1·2) in Cyprus to a high of 7·1 livebirths (6·8–7·4) in Niger. The TFR under age 25 years (TFU25; number of livebirths expected by age 25 years for a hypothetical woman who survived the age group and was exposed to current ASFRs) in 2017 ranged from 0·08 livebirths (0·07–0·09) in South Korea to 2·4 livebirths (2·2–2·6) in Niger, and the TFR over age 30 years (TFO30; number of livebirths expected for a hypothetical woman ageing from 30 to 54 years who survived the age group and was exposed to current ASFRs) ranged from a low of 0·3 livebirths (0·3–0·4) in Puerto Rico to a high of 3·1 livebirths (3·0–3·2) in Niger. TFO30 was higher than TFU25 in 145 countries and territories in 2017. 33 countries had a negative population growth rate from 2010 to 2017, most of which were located in central, eastern, and western Europe, whereas population growth rates of more than 2·0% were seen in 33 of 46 countries in sub-Saharan Africa. In 2017, less than 65% of the national population was of working age in 12 of 34 high-income countries, and less than 50% of the national population was of working age in Mali, Chad, and Niger. Interpretation Population trends create demographic dividends and headwinds (ie, economic benefits and detriments) that affect national economies and determine national planning needs. Although TFRs are decreasing, the global population continues to grow as mortality declines, with diverse patterns at the national level and across age groups. To our knowledge, this is the first study to provide transparent and replicable estimates of population and fertility, which can be used to inform decision making and to monitor progress. Funding Bill & Melinda Gates Foundation.
    Rajat Das Gupta
    added 7 research items
    Background How long one lives, how many years of life are spent in good and poor health, and how the population's state of health and leading causes of disability change over time all have implications for policy, planning, and provision of services. We comparatively assessed the patterns and trends of healthy life expectancy (HALE), which quantifies the number of years of life expected to be lived in good health, and the complementary measure of disability-adjusted life-years (DALYs), a composite measure of disease burden capturing both premature mortality and prevalence and severity of ill health, for 359 diseases and injuries for 195 countries and territories over the past 28 years. Methods We used data for age-specific mortality rates, years of life lost (YLLs) due to premature mortality, and years lived with disability (YLDs) from the Global Burden of Diseases, Injuries, and Risk Factors Study (GBD) 2017 to calculate HALE and DALYs from 1990 to 2017. We calculated HALE using age-specific mortality rates and YLDs per capita for each location, age, sex, and year. We calculated DALYs for 359 causes as the sum of YLLs and YLDs. We assessed how observed HALE and DALYs differed by country and sex from expected trends based on Socio-demographic Index (SDI). We also analysed HALE by decomposing years of life gained into years spent in good health and in poor health, between 1990 and 2017, and extra years lived by females compared with males. Findings Globally, from 1990 to 2017, life expectancy at birth increased by 7·4 years (95% uncertainty interval 7·1–7·8), from 65·6 years (65·3–65·8) in 1990 to 73·0 years (72·7–73·3) in 2017. The increase in years of life varied from 5·1 years (5·0–5·3) in high SDI countries to 12·0 years (11·3–12·8) in low SDI countries. Of the additional years of life expected at birth, 26·3% (20·1–33·1) were expected to be spent in poor health in high SDI countries compared with 11·7% (8·8–15·1) in low-middle SDI countries. HALE at birth increased by 6·3 years (5·9–6·7), from 57·0 years (54·6–59·1) in 1990 to 63·3 years (60·5–65·7) in 2017. The increase varied from 3·8 years (3·4–4·1) in high SDI countries to 10·5 years (9·8–11·2) in low SDI countries. Even larger variations in HALE than these were observed between countries, ranging from 1·0 year (0·4–1·7) in Saint Vincent and the Grenadines (62·4 years [59·9–64·7] in 1990 to 63·5 years [60·9–65·8] in 2017) to 23·7 years (21·9–25·6) in Eritrea (30·7 years [28·9–32·2] in 1990 to 54·4 years [51·5–57·1] in 2017). In most countries, the increase in HALE was smaller than the increase in overall life expectancy, indicating more years lived in poor health. In 180 of 195 countries and territories, females were expected to live longer than males in 2017, with extra years lived varying from 1·4 years (0·6–2·3) in Algeria to 11·9 years (10·9–12·9) in Ukraine. Of the extra years gained, the proportion spent in poor health varied largely across countries, with less than 20% of additional years spent in poor health in Bosnia and Herzegovina, Burundi, and Slovakia, whereas in Bahrain all the extra years were spent in poor health. In 2017, the highest estimate of HALE at birth was in Singapore for both females (75·8 years [72·4–78·7]) and males (72·6 years [69·8–75·0]) and the lowest estimates were in Central African Republic (47·0 years [43·7–50·2] for females and 42·8 years [40·1–45·6] for males). Globally, in 2017, the five leading causes of DALYs were neonatal disorders, ischaemic heart disease, stroke, lower respiratory infections, and chronic obstructive pulmonary disease. Between 1990 and 2017, age-standardised DALY rates decreased by 41·3% (38·8–43·5) for communicable diseases and by 49·8% (47·9–51·6) for neonatal disorders. For non-communicable diseases, global DALYs increased by 40·1% (36·8–43·0), although age-standardised DALY rates decreased by 18·1% (16·0–20·2). Interpretation With increasing life expectancy in most countries, the question of whether the additional years of life gained are spent in good health or poor health has been increasingly relevant because of the potential policy implications, such as health-care provisions and extending retirement ages. In some locations, a large proportion of those additional years are spent in poor health. Large inequalities in HALE and disease burden exist across countries in different SDI quintiles and between sexes. The burden of disabling conditions has serious implications for health system planning and health-related expenditures. Despite the progress made in reducing the burden of communicable diseases and neonatal disorders in low SDI countries, the speed of this progress could be increased by scaling up proven interventions. The global trends among non-communicable diseases indicate that more effort is needed to maximise HALE, such as risk prevention and attention to upstream determinants of health.
    Background Assessments of age-specific mortality and life expectancy have been done by the UN Population Division, Department of Economics and Social Affairs (UNPOP), the United States Census Bureau, WHO, and as part of previous iterations of the Global Burden of Diseases, Injuries, and Risk Factors Study (GBD). Previous iterations of the GBD used population estimates from UNPOP, which were not derived in a way that was internally consistent with the estimates of the numbers of deaths in the GBD. The present iteration of the GBD, GBD 2017, improves on previous assessments and provides timely estimates of the mortality experience of populations globally. Methods The GBD uses all available data to produce estimates of mortality rates between 1950 and 2017 for 23 age groups, both sexes, and 918 locations, including 195 countries and territories and subnational locations for 16 countries. Data used include vital registration systems, sample registration systems, household surveys (complete birth histories, summary birth histories, sibling histories), censuses (summary birth histories, household deaths), and Demographic Surveillance Sites. In total, this analysis used 8259 data sources. Estimates of the probability of death between birth and the age of 5 years and between ages 15 and 60 years are generated and then input into a model life table system to produce complete life tables for all locations and years. Fatal discontinuities and mortality due to HIV/AIDS are analysed separately and then incorporated into the estimation. We analyse the relationship between age-specific mortality and development status using the Socio-demographic Index, a composite measure based on fertility under the age of 25 years, education, and income. There are four main methodological improvements in GBD 2017 compared with GBD 2016: 622 additional data sources have been incorporated; new estimates of population, generated by the GBD study, are used; statistical methods used in different components of the analysis have been further standardised and improved; and the analysis has been extended backwards in time by two decades to start in 1950. Findings Globally, 18·7% (95% uncertainty interval 18·4–19·0) of deaths were registered in 1950 and that proportion has been steadily increasing since, with 58·8% (58·2–59·3) of all deaths being registered in 2015. At the global level, between 1950 and 2017, life expectancy increased from 48·1 years (46·5–49·6) to 70·5 years (70·1–70·8) for men and from 52·9 years (51·7–54·0) to 75·6 years (75·3–75·9) for women. Despite this overall progress, there remains substantial variation in life expectancy at birth in 2017, which ranges from 49·1 years (46·5–51·7) for men in the Central African Republic to 87·6 years (86·9–88·1) among women in Singapore. The greatest progress across age groups was for children younger than 5 years; under-5 mortality dropped from 216·0 deaths (196·3–238·1) per 1000 livebirths in 1950 to 38·9 deaths (35·6–42·83) per 1000 livebirths in 2017, with huge reductions across countries. Nevertheless, there were still 5·4 million (5·2–5·6) deaths among children younger than 5 years in the world in 2017. Progress has been less pronounced and more variable for adults, especially for adult males, who had stagnant or increasing mortality rates in several countries. The gap between male and female life expectancy between 1950 and 2017, while relatively stable at the global level, shows distinctive patterns across super-regions and has consistently been the largest in central Europe, eastern Europe, and central Asia, and smallest in south Asia. Performance was also variable across countries and time in observed mortality rates compared with those expected on the basis of development. Interpretation This analysis of age-sex-specific mortality shows that there are remarkably complex patterns in population mortality across countries. The findings of this study highlight global successes, such as the large decline in under-5 mortality, which reflects significant local, national, and global commitment and investment over several decades. However, they also bring attention to mortality patterns that are a cause for concern, particularly among adult men and, to a lesser extent, women, whose mortality rates have stagnated in many countries over the time period of this study, and in some cases are increasing.
    Summary Background Efforts to establish the 2015 baseline and monitor early implementation of the UN Sustainable Development Goals (SDGs) highlight both great potential for and threats to improving health by 2030. To fully deliver on the SDG aim of “leaving no one behind”, it is increasingly important to examine the health-related SDGs beyond national-level estimates. As part of the Global Burden of Diseases, Injuries, and Risk Factors Study 2017 (GBD 2017), we measured progress on 41 of 52 health-related SDG indicators and estimated the health-related SDG index for 195 countries and territories for the period 1990–2017, projected indicators to 2030, and analysed global attainment. Methods We measured progress on 41 health-related SDG indicators from 1990 to 2017, an increase of four indicators since GBD 2016 (new indicators were health worker density, sexual violence by non-intimate partners, population census status, and prevalence of physical and sexual violence [reported separately]). We also improved the measurement of several previously reported indicators. We constructed national-level estimates and, for a subset of health-related SDGs, examined indicator-level differences by sex and Socio-demographic Index (SDI) quintile. We also did subnational assessments of performance for selected countries. To construct the health-related SDG index, we transformed the value for each indicator on a scale of 0–100, with 0 as the 2·5th percentile and 100 as the 97·5th percentile of 1000 draws calculated from 1990 to 2030, and took the geometric mean of the scaled indicators by target. To generate projections through 2030, we used a forecasting framework that drew estimates from the broader GBD study and used weighted averages of indicator-specific and country-specific annualised rates of change from 1990 to 2017 to inform future estimates. We assessed attainment of indicators with defined targets in two ways: first, using mean values projected for 2030, and then using the probability of attainment in 2030 calculated from 1000 draws. We also did a global attainment analysis of the feasibility of attaining SDG targets on the basis of past trends. Using 2015 global averages of indicators with defined SDG targets, we calculated the global annualised rates of change required from 2015 to 2030 to meet these targets, and then identified in what percentiles the required global annualised rates of change fell in the distribution of country-level rates of change from 1990 to 2015. We took the mean of these global percentile values across indicators and applied the past rate of change at this mean global percentile to all health-related SDG indicators, irrespective of target definition, to estimate the equivalent 2030 global average value and percentage change from 2015 to 2030 for each indicator. Findings The global median health-related SDG index in 2017 was 59·4 (IQR 35·4–67·3), ranging from a low of 11·6 (95% uncertainty interval 9·6–14·0) to a high of 84·9 (83·1–86·7). SDG index values in countries assessed at the subnational level varied substantially, particularly in China and India, although scores in Japan and the UK were more homogeneous. Indicators also varied by SDI quintile and sex, with males having worse outcomes than females for non-communicable disease (NCD) mortality, alcohol use, and smoking, among others. Most countries were projected to have a higher health-related SDG index in 2030 than in 2017, while country-level probabilities of attainment by 2030 varied widely by indicator. Under-5 mortality, neonatal mortality, maternal mortality ratio, and malaria indicators had the most countries with at least 95% probability of target attainment. Other indicators, including NCD mortality and suicide mortality, had no countries projected to meet corresponding SDG targets on the basis of projected mean values for 2030 but showed some probability of attainment by 2030. For some indicators, including child malnutrition, several infectious diseases, and most violence measures, the annualised rates of change required to meet SDG targets far exceeded the pace of progress achieved by any country in the recent past. We found that applying the mean global annualised rate of change to indicators without defined targets would equate to about 19% and 22% reductions in global smoking and alcohol consumption, respectively; a 47% decline in adolescent birth rates; and a more than 85% increase in health worker density per 1000 population by 2030. Interpretation The GBD study offers a unique, robust platform for monitoring the health-related SDGs across demographic and geographic dimensions. Our findings underscore the importance of increased collection and analysis of disaggregated data and highlight where more deliberate design or targeting of interventions could accelerate progress in attaining the SDGs. Current projections show that many health-related SDG indicators, NCDs, NCD-related risks, and violence-related indicators will require a concerted shift away from what might have driven past gains—curative interventions in the case of NCDs—towards multisectoral, prevention-oriented policy action and investments to achieve SDG aims. Notably, several targets, if they are to be met by 2030, demand a pace of progress that no country has achieved in the recent past. The future is fundamentally uncertain, and no model can fully predict what breakthroughs or events might alter the course of the SDGs. What is clear is that our actions—or inaction—today will ultimately dictate how close the world, collectively, can get to leaving no one behind by 2030. Funding Bill & Melinda Gates Foundation.
    Rajat Das Gupta
    added a project goal
    The Global Burden of Disease Study (GBD) is a comprehensive regional and global research program of disease burden that assesses mortality and disability from major diseases, injuries, and risk factors. GBD is a collaboration of over 1,800 researchers from 127 countries.
    …