Translate AMICOR contents if you like

Showing posts with label mortality. Show all posts

Monday, November 05, 2018

Smoking and Mortality Risk in US

Key Points
Question  What is the association of cigar, pipe, and cigarette use with mortality risk in the US population?
Findings  In this nationally representative longitudinal cohort study of 357 420 participants comparing exclusive cigar, pipe, and cigarette use with mortality risk, a statistically significantly elevated risk of tobacco-related cancer mortality among exclusive current and former cigarette smokers, current cigar smokers, and current pipe smokers, as well as a statistically significantly elevated risk of mortality from most examined causes of death among both current daily and nondaily cigarette smokers, were demonstrated.
Meaning  Use of cigar, pipe, and cigarettes each confers mortality risks.
Abstract
Importance  Tobacco products have changed in recent years. Contemporary mortality risk estimates of combustible tobacco product use are needed.
Objective  To investigate the mortality risks associated with current and former use of cigars, pipes, and cigarettes.
Design, Setting, and Participants  The National Longitudinal Mortality Study is a longitudinal population-based, nationally representative health survey with mortality follow-up that includes demographic and other information from the Current Population Survey, tobacco product use information from the Tobacco Use Supplement, and mortality data from the National Death Index. In this study, participants provided tobacco use information at baseline in surveys starting from 1985 and were followed for mortality through the end of 2011. The study includes 357 420 participants who reported exclusively using cigar, pipes, or cigarettes or reported never using any type of tobacco product.
Exposures  Current or former exclusive use of any cigar (little cigar, cigarillos, large cigar), traditional pipe, or cigarette and never tobacco use. Information on current daily and nondaily use was also collected. Estimates adjusted for age, sex, race/ethnicity, education, and survey year.
Main Outcomes and Measures  All-cause and cause-specific mortality as identified as the primary cause of death from death certificate information.
Results  Of the 357 420 persons included in the analysis, the majority of current and former cigar and pipe smokers were male (79.3%-98.0%), and smokers were more evenly divided by sex (46% of current daily smokers were male). There were 51 150 recorded deaths during follow-up. Exclusive current cigarette smokers (hazard ratio [HR], 1.98; 95% CI, 1.93-2.02) and exclusive current cigar smokers (HR, 1.20; 95% CI, 1.03-1.38) had higher all-cause mortality risks than never tobacco users. Exclusive current cigarette smokers (HR, 4.06; 95% CI, 3.84-4.29), exclusive current cigar smokers (HR, 1.61; 95% CI, 1.11-2.32), and exclusive current pipe smokers (HR, 1.58; 95% CI, 1.05-2.38) had an elevated risk of dying from a tobacco-related cancer (including bladder, esophagus, larynx, lung, oral cavity, and pancreas). Among current nondaily cigarette users, statistically significant associations were observed with deaths from lung cancer (HR, 6.24; 95% CI, 5.17-7.54), oral cancer (HR, 4.62; 95% CI, 1.84-11.58), circulatory death (HR, 1.43; 95% CI, 1.30-1.57), cardiovascular death (HR, 1.24; 95% CI, 1.11-1.39), cerebrovascular death (stroke) (HR, 1.39; 95% CI, 1.12-1.74), and chronic obstructive pulmonary disease (HR, 7.66; 95% CI, 6.09-9.64) as well as for daily smokers.
Conclusions and Relevance  This study provides further evidence that exclusive use of cigar, pipes, and cigarettes each confers significant mortality risks.

Sunday, September 23, 2018

Child Mortality Report 2018


Levels and Trends in Child Mortality Report 2018

Publication cover
Author:UNICEF, WHO, World Bank Group and United NationsPrice:FreeNo. of pages:44Publication date:September 2018Publisher:UNICEF
Available language versions
English
Available formats
For further information
The United Nations Interagency Group for Child Mortality Estimation (UN IGME) produces estimates of child and young adolescent mortality annually. This report presents the UN IGME’s latest estimates – up to the year 2017 – of under-five, infant, and neonatal mortality as well as mortality among children aged 5–14. It assesses progress in the reduction of child and young adolescent mortality at the country, regional and global levels, and provides an overview of the methods used to estimate the child mortality indicators mentioned above.

Sunday, April 22, 2018

Diabetes mortality: SGLT-2 x DPP-4

Original Investigation
April 17, 2018

Association Between Use of Sodium-Glucose Cotransporter 2 Inhibitors, Glucagon-like Peptide 1 Agonists, and Dipeptidyl Peptidase 4 Inhibitors With All-Cause Mortality in Patients With Type 2 DiabetesA Systematic Review and Meta-analysis

Monday, February 12, 2018

Life Expectancy Dropped


3 Reasons Life Expectancy in America Has Dropped Dramatically
Experts say drugs, alcohol and suicides are contributing to a drop in U.S. life expectancy, especially among middle-aged white Americans

Wednesday, November 22, 2017

BR: Mortalidade hospitalar

Giovanni Bello/Folhapress
Saúde


Cerca de 829 brasileiros morrem diariamente em hospitais públicos e privados por falhas que poderiam ser evitadas, segundo o Anuário da Segurança Assistencial Hospitalar no Brasil, realizado pelo IESS (Instituto de Estudos de Saúd... - Veja mais em https://noticias.uol.com.br/saude/ultimas-noticias/redacao/2017/11/22/a-cada-5-minutos-3-brasileiros-morrem-em-hospitais-por-falhas.htm?cmpid=copiaecola

Tuesday, January 12, 2016

Underlying Cause of Death by age


Not to be morbid, but what are you likely to die from?
Nathan Yau of Flowing Data has created a fascinating interactive chart that shows the answer, according to statistics. Drawing on data from the Centers for Disease Control and Prevention's Underlying Cause of Death database, Yau charted the cause of death for Americans by age.
Here's what the chart looks like for women overall::
Note that this chart shows percentages by age group, not absolute numbers. There are far more people dying in 70s and 80s than there are in their 20s, but this kind of chart gives them all equal space, to show you how deaths break down by percentages.

Monday, November 02, 2015

War Death Cash Nexus

MILITARY DEATH TOLLS -- 11/02/15

Today's selection -- from The Cash Nexus by Niall Ferguson. With the dawn of the Industrial Age, casualties suffered by Western forces in wars increased dramatically and culminated in the 57 million deaths of World War II. Since that peak, however, casualties suffered by these same Western forces have slowed precipitously. Why?:
"The death toll of the War of the Spanish Succession (1701-13) was 1.2 million. A century later, the Napoleonic Wars killed 1.9 million men. And a century after that, the First World War cost more than 9 million servicemen their lives. Perhaps as many as 8 million people died in the maelstrom of the Russian Civil War of 1918-21 (though most of these were the victims of the famine and pestilence unleashed by the conflict). But even this figure pales into insignificance alongside the total mortality caused by the Second World War. For military personnel, the total body count was roughly twice the figure for the First World War. But this figure excludes civilian casualties. According to the best available estimates, total civilian deaths in the Second World War amounted to 37.8 million, bringing the total death toll to nearly 57 million people. In other words, the majority of deaths in the Second World War were due to deliberate targeting -- by all sides -- of civilians on land and sea and from the air. Including all the minor colonial wars like the Boer War and all the civil wars like the one that raged in India after independence, the total figure for war deaths between 1900 and 1950 approaches 80 million./.../

Friday, August 07, 2015

5 y Mortality Predictors

Summary

Background

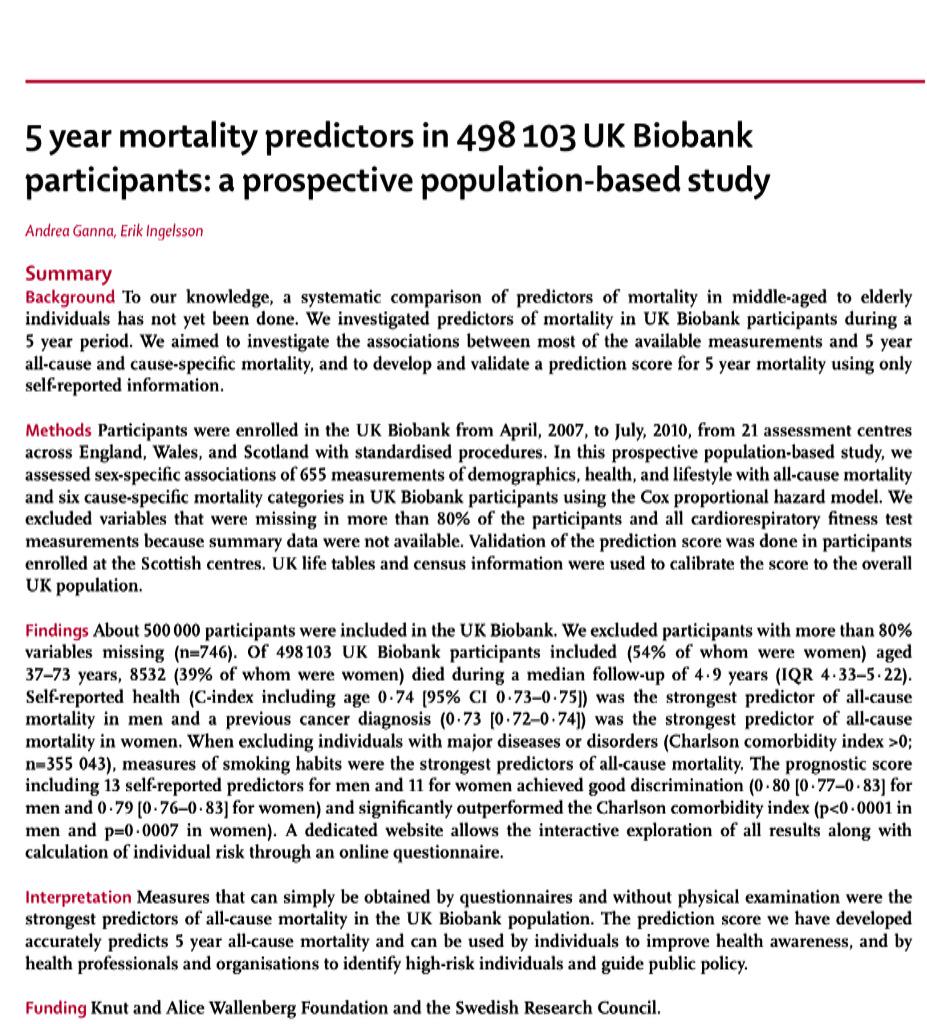
To our knowledge, a systematic comparison of predictors of mortality in middle-aged to elderly individuals has not yet been done. We investigated predictors of mortality in UK Biobank participants during a 5 year period. We aimed to investigate the associations between most of the available measurements and 5 year all-cause and cause-specific mortality, and to develop and validate a prediction score for 5 year mortality using only self-reported information.

Methods

Participants were enrolled in the UK Biobank from April, 2007, to July, 2010, from 21 assessment centres across England, Wales, and Scotland with standardised procedures. In this prospective population-based study, we assessed sex-specific associations of 655 measurements of demographics, health, and lifestyle with all-cause mortality and six cause-specific mortality categories in UK Biobank participants using the Cox proportional hazard model. We excluded variables that were missing in more than 80% of the participants and all cardiorespiratory fitness test measurements because summary data were not available. Validation of the prediction score was done in participants enrolled at the Scottish centres. UK life tables and census information were used to calibrate the score to the overall UK population.

Findings

About 500 000 participants were included in the UK Biobank. We excluded participants with more than 80% variables missing (n=746). Of 498 103 UK Biobank participants included (54% of whom were women) aged 37–73 years, 8532 (39% of whom were women) died during a median follow-up of 4·9 years (IQR 4·33–5·22). Self-reported health (C-index including age 0·74 [95% CI 0·73–0·75]) was the strongest predictor of all-cause mortality in men and a previous cancer diagnosis (0·73 [0·72–0·74]) was the strongest predictor of all-cause mortality in women. When excluding individuals with major diseases or disorders (Charlson comorbidity index >0; n=355 043), measures of smoking habits were the strongest predictors of all-cause mortality. The prognostic score including 13 self-reported predictors for men and 11 for women achieved good discrimination (0·80 [0·77–0·83] for men and 0·79 [0·76–0·83] for women) and significantly outperformed the Charlson comorbidity index (p<0 a="" and="" href="http://www.ubble.co.uk/" in="" men="" nbsp="" p="0·0007" style="color: #004480; text-decoration: none;" target="_blank" women="">dedicated website
 allows the interactive exploration of all results along with calculation of individual risk through an online questionnaire.

Interpretation

Measures that can simply be obtained by questionnaires and without physical examination were the strongest predictors of all-cause mortality in the UK Biobank population. The prediction score we have developed accurately predicts 5 year all-cause mortality and can be used by individuals to improve health awareness, and by health professionals and organisations to identify high-risk individuals and guide public policy./.../

Supplementary Material

TitleDescriptionTypeSize
pdf iconSupplementary appendixpdf1.82 MB
microsoft excel iconSupplementary appendixxlsx5.52 MB

Thursday, June 04, 2015

5-year mortality predictors


Tweet text